Figure 2.

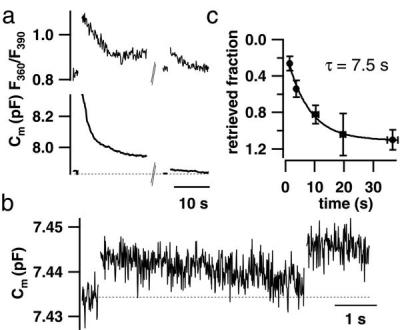
Endocytosis in IHCs. (a) Low time resolution plot of [Ca2+]i (Upper) and Cm (Lower) of a cell. Both Cm and [Ca2+]i increased after a 500-ms pulse, and, 30 s later, smaller responses were elicited by a 50-ms depolarization. After the depolarizations, Cm and [Ca2+]i declined in parallel (whole-cell configuration; 0.1 mM FURA-2 added to the pipette solution). (b) Paired pulses (twice for 15 ms to −15 mV) with variable interval between both stimuli were used to measure the time course of endocytosis in 11 perforated-patch experiments. b shows an example Cm trace with an interval of 5 s (smoothed by box averaging; n = 5). (c) Cm values measured right after the first stimulus and before the second stimulus were used to calculate the endocytosed fraction of the Cm increment elicited by the first depolarization (ΔCm1) at a certain interval. The solid line is an exponential fit to the data.
