
Figure 5.
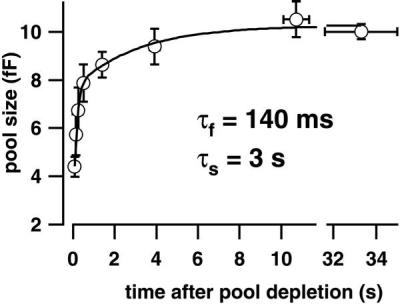
Rapid recovery from RRP depletion. Paired pulses (twice for 15 ms to −15 mV) were used to measure the time course of pool recovery in 11 perforated-patch experiments (see Fig. 2b for an example trace). The second response (ΔCm2), measured at variable times after the first pool-depleting response (ΔCm1), indicated the refilling state of the RRP. The summary plot shows ratios ΔCm2/ΔCm1 multiplied by the steady state ΔCm2 (10.2 fF), which was similar to our RRP size estimate (see Fig. 4C). Solid line, double exponential fit to the data (see Results).