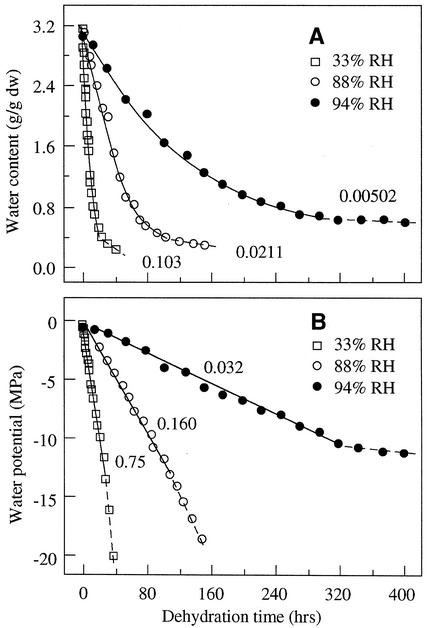
Figure 1.
Changes in water content (A) and water potential (B) in cocoa embryonic axes under three constant relative humidities at 16°C. Data points of the first drying phase in Figure 1A were fitted with an exponential function (solid lines), and the rate constant of water loss was shown near each drying curve. The decrease in water potential in Figure 1B followed a linear function during the first phase of drying, and the slope of the linear plots, ΔΨ/Δt, was rate of dehydration that measures desiccation stress intensity during drying. Note the change of the slope in Figure 1B at water potential around −12 to −15 MPa. Water in axis tissues at water potential below −12 to −15 MPa is osmotically inactive water and is held by matric and molecular forces. Similar results were obtained with axes dried at 25°C.

