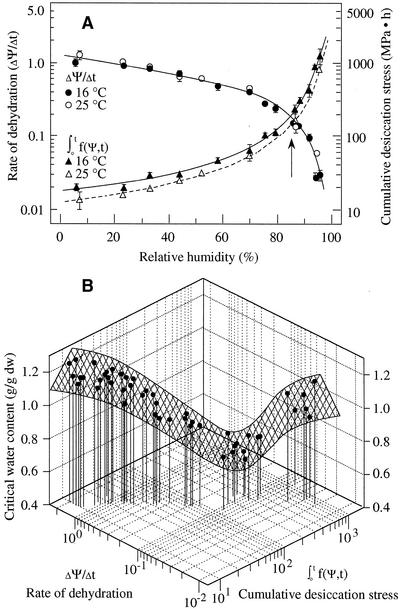
Figure 7.
A, Rate of dehydration (ΔΨ/Δt) and cumulative desiccation stress ∫ f(ψ,t), of cocoa embryonic axes dried under various relative humidities at 16°C and 25°C. B, The influences of ΔΨ/Δt and ∫
 f(ψ,t) on desiccation tolerance of embryonic axes. The three-dimensional surface was drawn with fitted regression equation (see Table I). The maximum desiccation tolerance of embryonic axes (the valley of the three-dimensional surface) corresponded to relative humidity around approximately 88%, as indicated by the arrow in Figure 7A.

