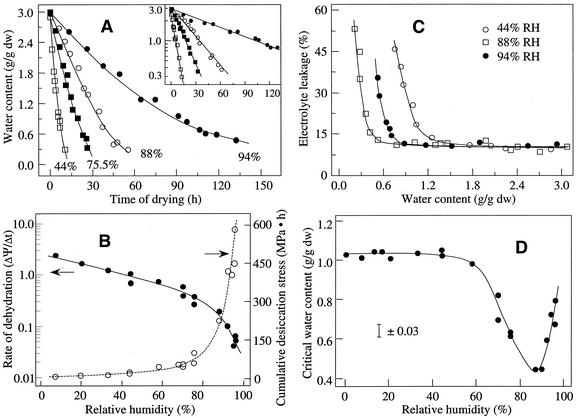
Figure 8.
(A) Changes of water content in ginkgo embryos during desiccation at relative humidity 44%, 75.5%, 88%, and 94% at 16°C. Inset shows the first order plot for the calculation of rate constant of water loss. B, Rate of dehydration (ΔΨ/Δt) and cumulative desiccation stress ∫ f(ψ,t), of ginkgo embryos that were dried under different relative humidities. C, Representative plots between electrolyte leakage and water content shows the optimal drying condition at relative humidity 88%. D, Desiccation tolerance of ginkgo embryos that were dried under different relative humidities.

