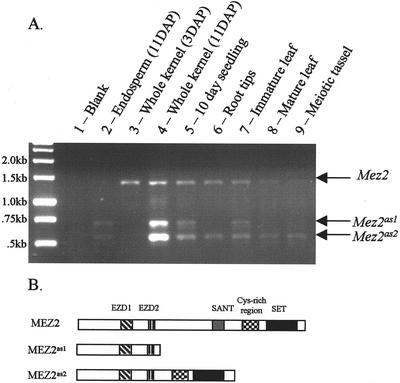
Figure 7.
Alternative splicing of Mez2. A, PCR amplification of Mez2 transcripts from various maize tissues. The expected size of the amplified band is 2.2 kb. The presence of multiple bands indicates alternative splicing of the Mez2 transcript. Different tissues displayed different patterns of splicing for Mez2. The three bands amplified from ear tissue (indicated by the arrows at the right of the picture) were sequenced and are designated at Mez2, Mez2as1, and Mez2as2. The products amplified from embryo tissue were also cloned and sequenced and were all found to correspond to Mez2as2. B, Schematic diagrams of the alternative splicing event and the altered proteins. The shading pattern is identical to that used in Figure 3. Mez2as1 introduces a frameshift and will produce a truncated protein that lacks the SANT, NLS, Cys-rich, and SET domains. Mez2as2 produces an in-frame deletion that removes only the SANT domain.

