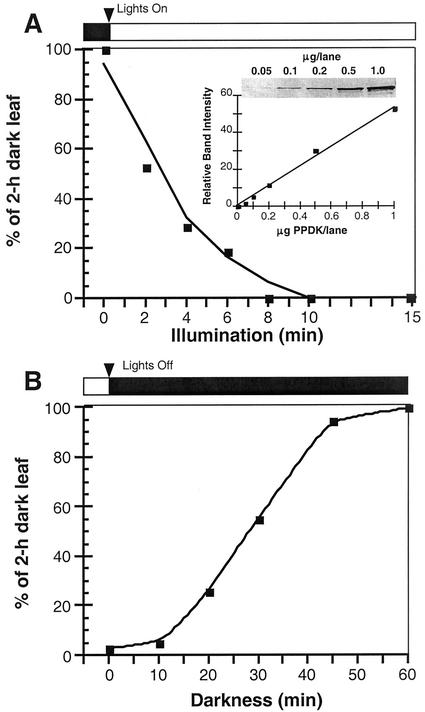
Figure 3.
Kinetic analysis of light-/dark-regulated changes in PPDK phosphorylation state in maize (C4) leaves. Each time point represents the relative image intensity of phospho-PPDK bands on immunoblots as a percent of that in a dark-adapted (2 h) leaf. A, Illumination of darkened leaves was initiated at approximately 800 μmol m−2 s−1 for a period of up to 15 min. B, After a 1-h illumination period, leaves were returned to darkness and sampled at 10 to 60 min. Soluble protein loaded per lane was 30 μg. Total dikinase protein per sample was normalized by probing duplicate blots with standard PPDK antibody. Each time point is the mean of three separate experiments. Inset in A shows standardized control blots of purified maize C4 PPDK showing linearity of scanned band-signal intensity up to 1 μg of PPDK. Bands on immunoblots used for Figures 3 and 4 were all within this linear range.

