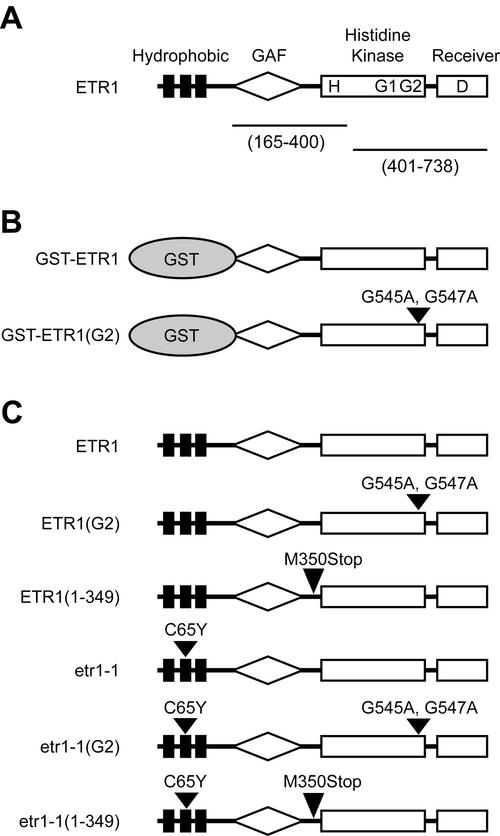
Figure 1.
Structure of ETR1 and constructs used for experimental analysis. The hydrophobic ethylene-sensing domain, the GAF domain, the His kinase domain, and the receiver domain are indicated. H indicates His-353 and D indicates Asp-659, the putative phosphorylation sites. G1 and G2 indicate positions of the G1 and G2 boxes within the kinase domain. A, Domains of the full-length ETR1 protein. Positions of regions used to generate the anti-ETR1(165–400) and anti-ETR1(401–738) antibodies are indicated. B, Versions of ETR1 expressed as glutathione S-transferase (GST) fusions in yeast. C, Versions of ETR1 expressed as transgenes in Arabidopsis.

