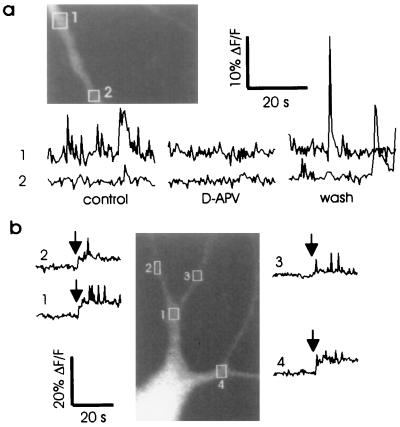
Figure 2.
MSCTs require NMDA receptor activation (a Inset) Fluo-3 image of a dendritic process. The average fluorescence intensity in the boxed areas 1 and 2 is shown during control period, during perfusion with medium containing 50 μM D-APV, and after washing out D-APV. Transient increases in fluorescence intensity observed in the control period was abolished during perfusion with D-APV and reappeared upon washing with control solution. Images were obtained in frame-scan mode (0.4 s between frames). (b) Fluo-3 image of a neuron with boxes drawn over areas where average fluorescence intensity was measured. Dye was loaded into the cell by using a patch pipette in the whole-cell recording mode. The perfusion medium contained 1.3 mM Mg2+ and 5 mM Ca2+. During the first 20 s of recording, the voltage at the soma was clamped at −70 mV. At the time indicated by the vertical arrow, the clamp voltage was switched to −30 mV. Note the appearance of MSCTs in the regions indicated. The increase in baseline fluorescence is due to depolarization-induced calcium influx.

