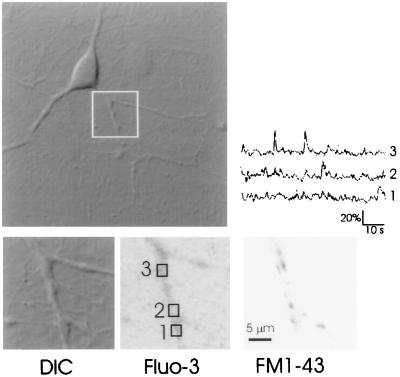
Figure 3.
FM1-43 staining at sites of origin of MSCTs. Differential interference contrast image of a neuron (Upper Left). The boxed region, magnified at bottom left (DIC), was scanned repeatedly in the frame-scan mode (265 ms per frame). Fluo-3 image of this region is shown (Lower Center), with the contrast inverted for clarity (Fluo-3). The time course of fluorescence in the three boxed regions is shown at Upper Right. After a number of images were obtained, the same dendritic region was labeled with FM1-43 to determine the locations of functional release sites (FM1-43). See Methods for details.

