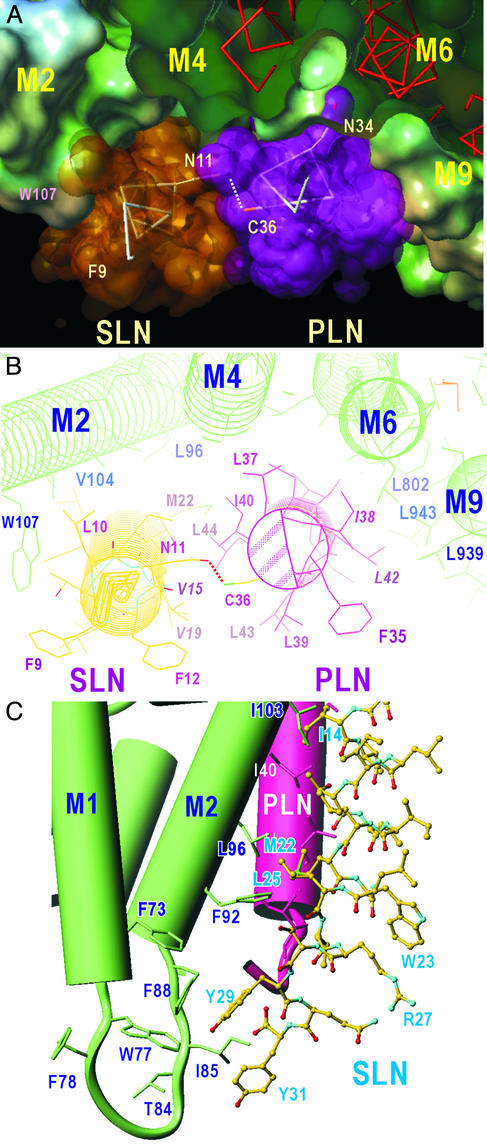
Figure 5.
A model for the ternary PLN/SLN/SERCA1a complex. (A) A view approximately normal to the membrane from the cytoplasmic side. The water-accessible surface of SERCA1a and van der Waals surfaces of SLN and PLN are shown. Transmembrane helices of SERCA1a (M2, M4, M6, and M9) are identified. (B) A view approximately normal to the membrane from the cytoplasmic side. Details of the interactions in the cytoplasmic half of the transmembrane region are shown. The shaded area in PLN indicates the region used for pentamer formation. Italicized amino acids (I38 and L42) show the two most important residues in hydrophobic contacts between PLN and SERCA, and the corresponding residues in SLN (V15 and V19). Dotted lines show a likely hydrogen bond between N11 (SLN) and C36 (PLN). (C) C-terminal half of SLN and the interaction with M2 of SERCA1a. Cylinders represent α-helices. The model is viewed in a shallow angle to the membrane so that the PLN transmembrane helix becomes approximately upright with the lumen of the sarcoplasmic reticulum at the bottom. M1 and M2 helices of SERCA1a are in green and the PLN transmembrane helix is in red. SLN is shown with a ball-and-stick representation. Note the cluster of aromatic residues near the luminal surface.

