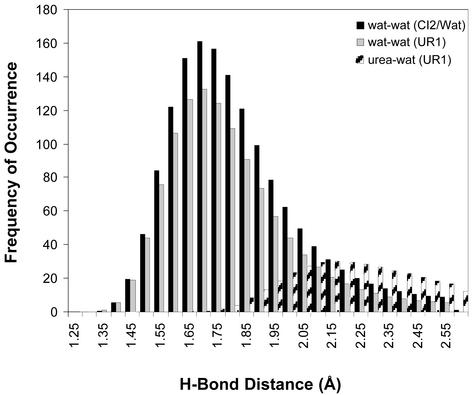
Figure 4.
Hydrogen bond distributions for CI2 in water and in 8 M urea. The probability of different hydrogen bond lengths during a 200-ps time interval from 0.8 to 1.0 ns, before unfolding, is displayed for water–water and water–urea interactions. The values are given for the bulk solvent (>3.5 Å from polar atoms and >4.5 Å from nonpolar atoms) and normalized by the average number of bulk molecules. Hydrogen bond criteria are provided in the legend to Table 1.

