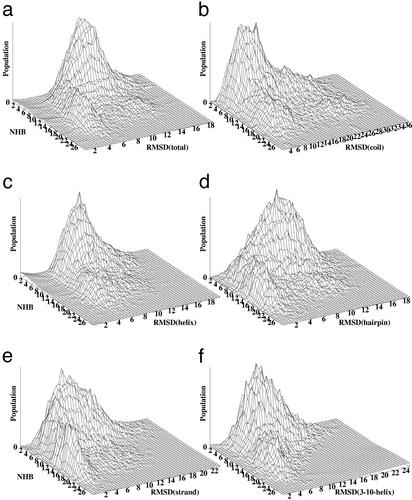
Figure 3.
Occupancy histograms monitor the hierarchy of structural loss for p27 (a), coil (b), α-helix (c), β-hairpin (d), β-strand (e), and 310-helix (f). The histograms are generated by averaging the results of 20 independent unfolding/unbinding simulations for p27 at T = 600 K and are represented as a function of the total number of the intermolecular hydrogen bonds (NHB) formed by p27 in the complex versus the rmsd from the crystal structure for p27 and for each of the p27 elements.

