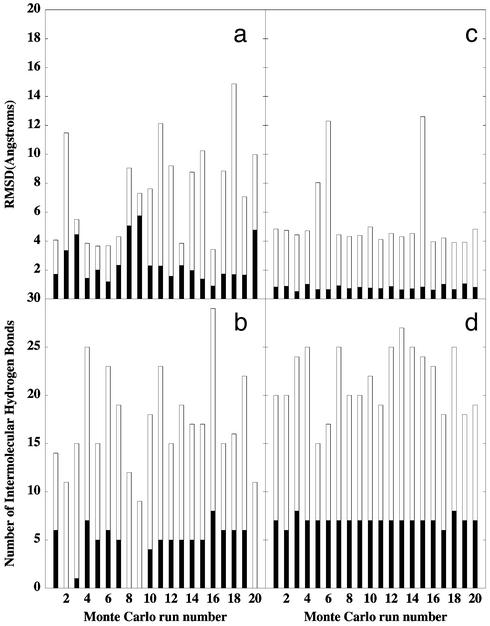
Figure 5.
The outcome of the 20 short kinetic runs for a representative conformation in the TSE (a and b) and in the ensemble of postcritical conformations (c and d). (a and c) The distribution of the rmsd values from the native bound conformation of p27 in the tertiary complex (empty bars), and the rmsd values of the β-strand (filled bars). (b and d) The distribution of the number of the intermolecular hydrogen bonds formed with the complex by p27 (empty bars) and by the β-strand (filled bars).

