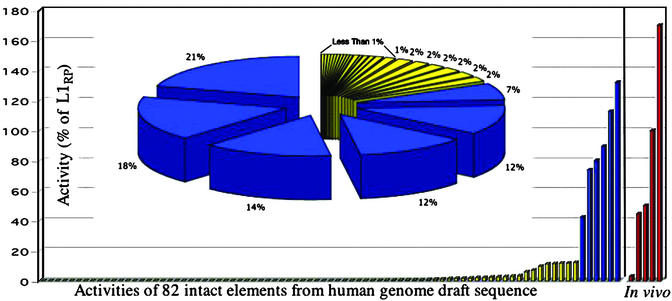
Figure 2.
L1 activity distribution. The measured potential activity of L1s from both the HGWD and de novo human insertions is shown. The histogram depicts the activities of 82 intact L1s from the HGWD and five human L1s involved in recent disease-causing insertions. The entire pie in the pie chart represents the total of all of the activity of the 82 L1s from the HGWD. Each slice of the pie represents the activity of a single element. The six hot elements (blue slices) represent 84% of the total measured potential activity in the HGWD.

