Figure 1.
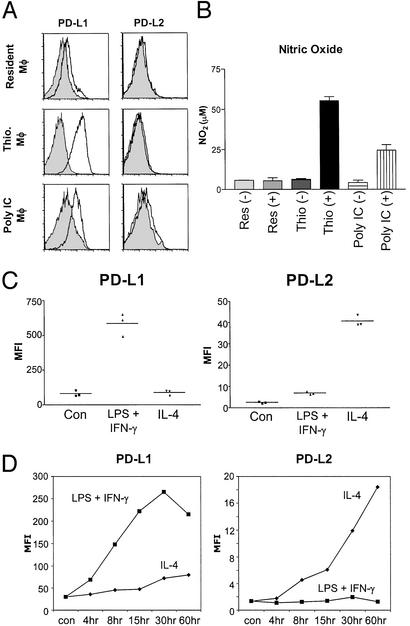
Expression of PD-L1 and PD-L2 on macrophages. (A) PD-L1 but not PD-L2 is expressed on inflammatory and activated resident macrophages. Peritoneal macrophages from untreated mice (Resident MΦ), mice injected with thioglycolate (Thio. MΦ), and mice injected with Poly IC (Poly IC MΦ) were stained for PD-L1 and PD-L2 expression (solid line), ex vivo, 72 h after treatment and compared with rat IgG2A isotype control antibody staining (shaded histogram). Data shown are representative of at least three separate mice in different experiments. (B) NO production after LPS and IFN-γ stimulation by macrophages expressing PD-L1. PD-L1-expressing macrophages produce more NO. Adherent peritoneal macrophages from treated mice were activated with LPS and IFN-γ (100 ng/ml) for 24 h before the supernatants were assayed for NO2. SD bars indicate variation between animals in treatment groups. (C) Differential up-regulation of PD-L1 and PD-L2 by type 1 and type 2 stimuli on inflammatory macrophages. Inflammatory macrophages from thioglycolate-treated mice were activated with IL-4 (20 ng/ml) or LPS + IFN-γ (100 ng/ml each) or cultured in medium alone for 24 h, after which cells were harvested and stained for PD-L1 and PD-L2 expression as well as for F4/80. Mean fluorescence intensity (MFI) of staining results shown are from F4/80+ gated cells alone (typically >90%). Data shown are representative of >10 experiments with similar results. (D) Time course of PD-L1 and PD-L2 up-regulation after stimulation. Macrophages were activated as described above and harvested at the indicated time points. Harvested cells were frozen (in FCS + 10% DMSO) and stained together at the end of the experiment. Time course data shown are representative of three separate experiments.

