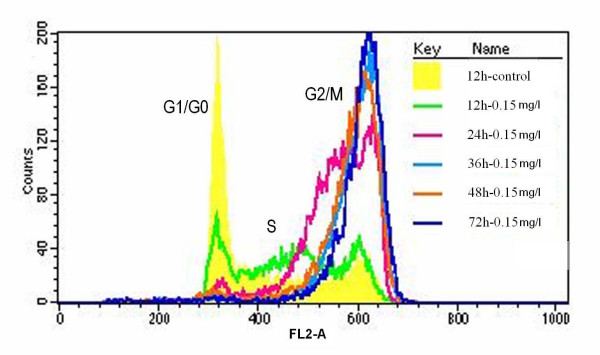
Figure 7.
Overlay of cell cycle distributions of Tca8113 cells exposed to 0.15 mg/l of VM-26 for a variety of time span. The cells were harvested and analyzed with propidium iodide staining to assess for cell cycle distribution by FACS analysis. The line in yellow, green, red, light blue, brown and blue indicate the cell cycle distributions of control cells, and of cells treated with teniposide for 12 hours, 24 hours, 36 hours, 48 hours and 72 hours, respectively. The cell cycle of Tca8113 cells were obviously arrested at G2/M phase as time lapsed. The results were expressed as mean ± SD of three independent experiments.

