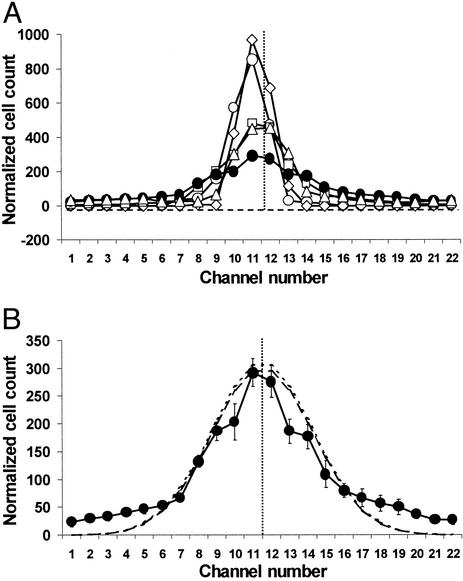
Figure 2.
Distribution of cells in the absence of gradients. Cells were grown as described. Cells of motile strains swam vigorously at the time of harvesting. (A) Washed cells in chemotaxis buffer were introduced into the microfluidic device and counted as described. The number of cells counted in each outlet port is given. The total number of cells was normalized to the mean number (2,105) of cells counted during seven runs with the WT strain. WT cells (●), aspartate-blind cells (▵), receptorless cells (□), flagellated, nonmotile cells (◊), and nonflagellated cells (○). The horizontal line with short dashes shows the no-cell baseline, and the vertical dotted line marks the middle of the device, corresponding to outlet 11.5. (B) The distribution of WT cells (from A), with error bars. In seven trials the standard error in the counts for well populated channels was <10%. The standard error across all outlets was ≈20%. The line with long dashes represents the best-fit Gaussian curve (σ = 3.6) for WT cells, and the line with short dashes represents the curve calculated for the case of diffusion from an extended source of limited extent (20). Note that there is little difference between the latter and the normal curve.

