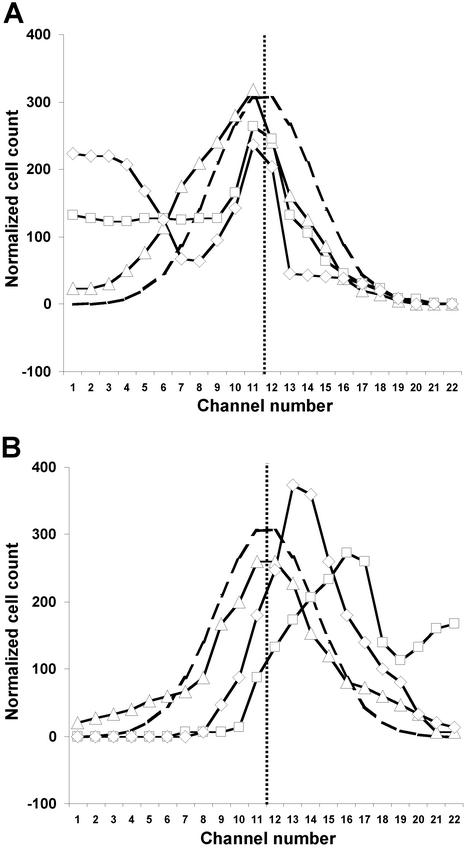
Figure 3.
Responses of WT cells to attractant and repellent. (A) Normalized cell counts were determined as in Fig. 2 for: 3.2 nM l-aspartate (▵), 10 nM l-aspartate (□), and 1 mM l-aspartate (◊). (B) Normalized cell counts for: 10 μM Ni2+ (▵), 1 mM Ni2+ (□), and 10 mM Ni2+ (◊). The curve with long dashes shows the normal distribution in the presence of buffer (Fig. 2B). The vertical line with short dashes marks the middle of the device.

