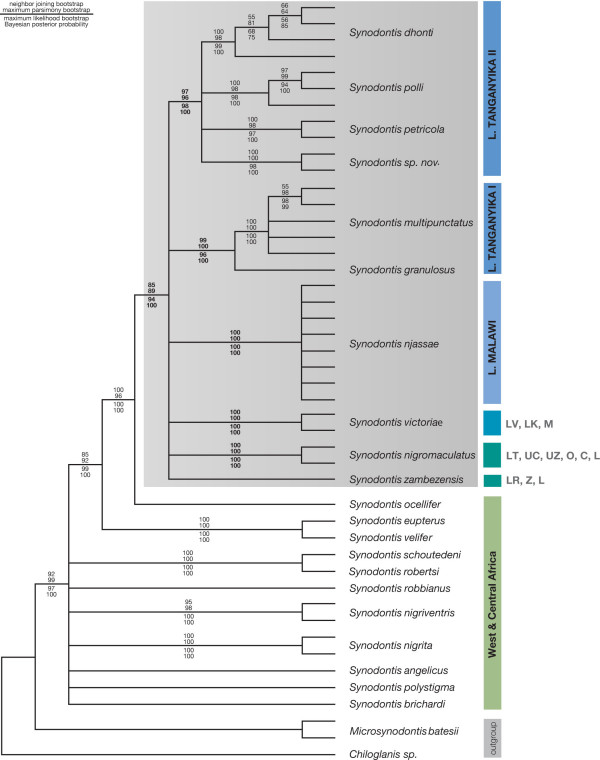
Figure 3.
Composite consensus tree of the phylogenetic analyses. The strictconsensus of the neighbor-joining tree, the most parsimonious trees, the optimal maximum likelihood topology (see Fig.4) and the Bayesian inference tree is shown. Numbers above the branches are neighbor-joining and maximum parsimony bootstrap values, numbers below the branches represent maximum likelihood bootstraps and Bayesian posterior probabilities. The grey box indicates the East African clade of Synodontis.

