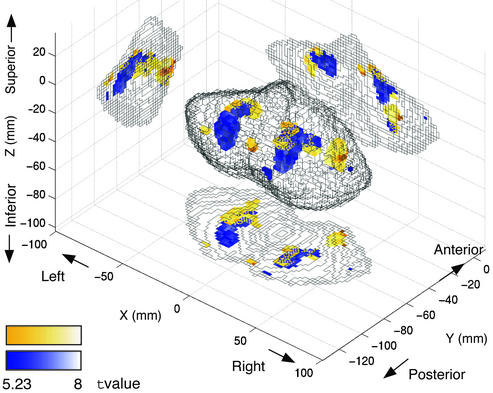
Figure 4.
Regions related to manipulation of the novel tools as revealed by multiple regression analysis. Regions are shown in superior–posterior–lateral view (Center), lateral view from right side (Left), superior view (Bottom), and posterior (Right) view. Orange and blue colors indicate regions where activation was more highly and positively correlated with manipulation of rotated or velocity mouse, respectively, than manipulation of normal mouse. Statistical thresholds are P < 0.001 corrected.

