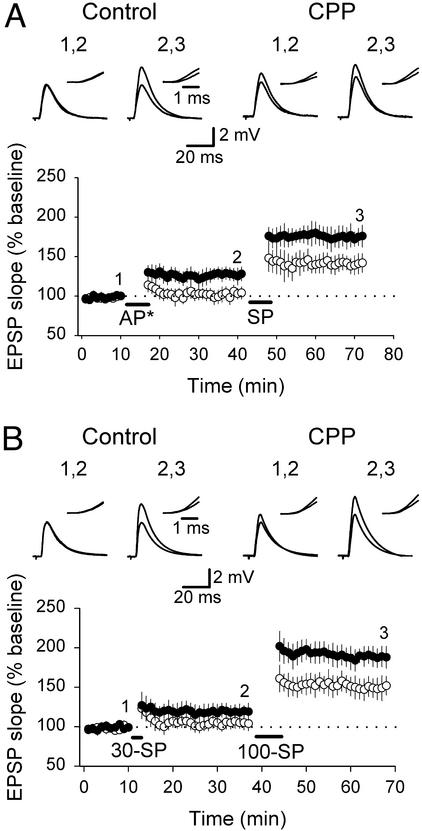
Figure 5.
Induction of LTP in CPP-treated slices occurs at a lower threshold. (A Lower) Summary plot showing that AP* (synaptic stimulation 50 ms after the postsynaptic burst) failed to induce LTP in control slices (○) whereas it produced LTP in CPP-treated slices (●). Subsequent SP resulted in additional potentiation in CPP-treated slices and induced LTP in control slices. (B) SP repeated 30 times induced LTP in CPP-treated slices (●) but no potentiation in control slices (○). Subsequent SP repeated 100 times resulted in LTP in control slices and induced even higher potentiation in CPP-treated slices. (A and B Upper) Example traces of EPSPs evoked at labeled time points are illustrated. (Insets) Superimposed rising phases of evoked EPSCs at a higher magnification.

