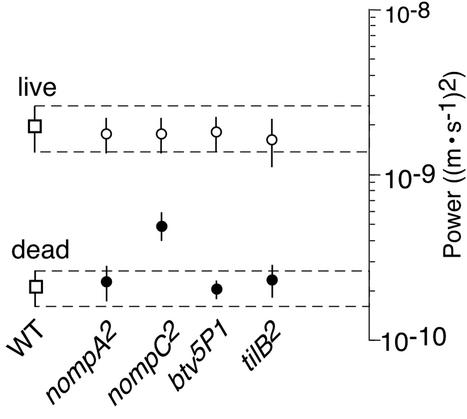
Figure 6.
Reduction of the oscillation power of the receiver in mechanosensory mutants. The oscillation power for live mutants (●) and respective controls (○) is compared with that of live and dead WT flies (□) (mean ± SD; seven flies per strain). Power is given as the total power spectral density in the frequency interval between 100 and 1,500 Hz. Hatched lines (±SD for WT flies) provide fiducials against which to judge differences in oscillation power.

