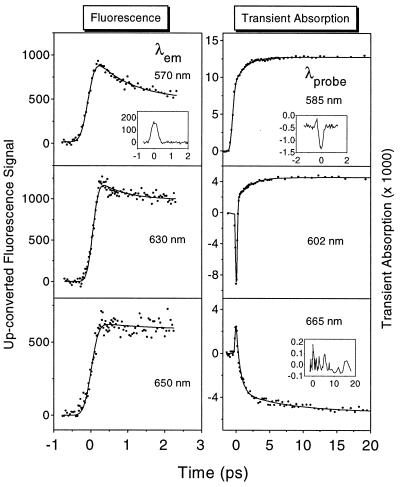
Figure 2.
The up-converted fluorescence and TA of E in water (short time scans). The excitation pulse at 480 nm was used. (Left) Signals detected at the wavelength indicated. (Right) TA at the indicated probe wavelength. (Insets) Signals of pure water measured under the same experimental conditions.

