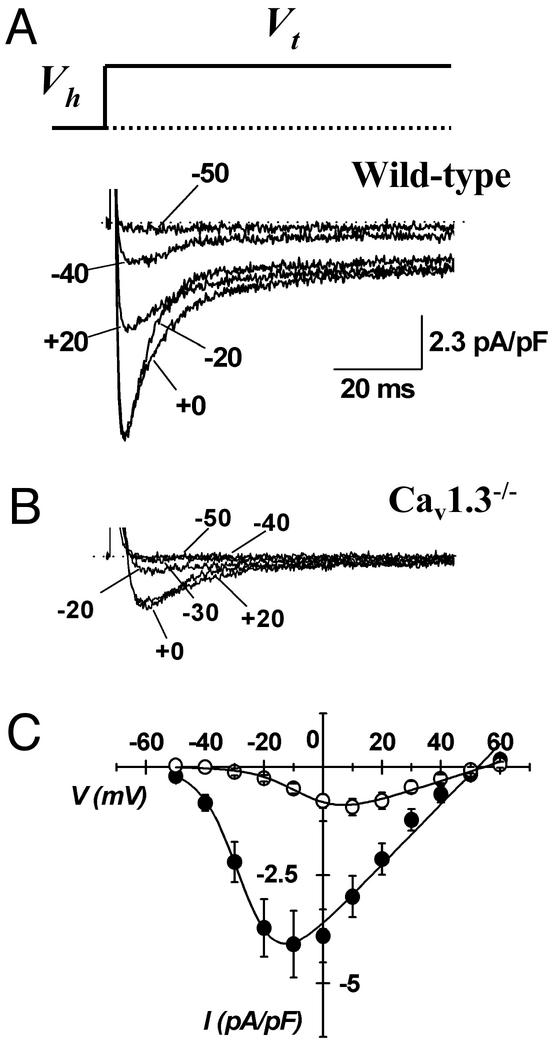
Figure 2.
Samples traces of ICa,L in SAN cells from wild-type (A) and homozygous Cav1.3−/− (B) mice. Recordings have been obtained by applying depolarizing voltage steps at variable voltages (Vt) indicated by arrows. Steps lasted 80 ms. Dotted lines indicate the zero current level. Holding potential (Vh) was −60 mV. (C) Averaged I–V relations of ICa,L in pacemaker cells from wild-type (filled circles) and Cav1.3−/− (open circles) mice, obtained from 21 independent experiments at a given voltage. Errors bars represent the SEM.

