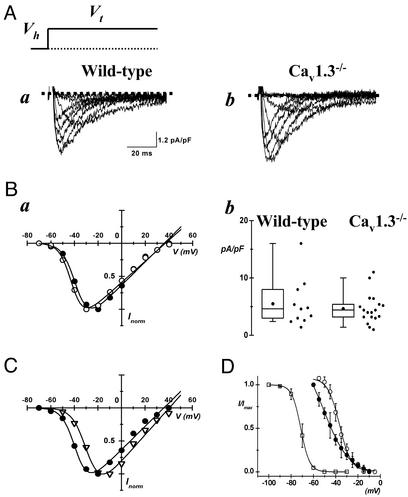
Figure 4.
(A) Sample traces recorded from wild-type (Aa) and Cav1.3−/− (Ab) mice. Records of ICa,T are shown after subtraction of ICa,L measured from a Vh of −60 mV from total ICa recorded from a Vh of −80 mV (see Materials and Methods). (Ba) Superimposition of corresponding I–V relations from cells shown in A (filled circles, wild type; open circles, Cav1.3−/−). (Bb) Box histogram showing ICa,T peak densities in SAN cells from wild-type and Cav1.3−/− mice. Filled circles in boxes represent the mean density. Corresponding 25th and 75th percentiles define the box. The 5th and the 95th percentiles define whiskers. Experimental data points are shown on the right of the corresponding box. (C) Superimposition of ICa,T measured in wild-type cells (filled circles) and the difference ICa,L obtained by subtracting the averaged ICa,L measured in Cav1.3−/− cells from the total ICa,L of wild-type cells (open triangles). (D) Steady-state inactivation curves for ICa,T in SAN cells from Cav1.3−/− (open squares) and for ICa,L in wild-type (filled circles) and Cav1.3−/− (open circles) mice. Preconditioning steps were applied for 5 s at voltages indicated in the abscissa. ICa,T and ICa,L were then evoked at a test potential of −30 mV and 0 mV, respectively. Test pulses lasted 80 ms. ICa,L inactivation was investigated positive to −60 mV to avoid possible interfering ICa,T. Fitting inactivation curve yielded parameter values of −71 ± 2 mV and −3.4 ± 0.06 for V0.5inact and si, respectively, (n = 3) for ICa,T, −45 ± 2 mV and 10 ± 0.2 for wild-type ICa,L, and −36 ± 2 mV and 4.6 ± 0.4 for ICa,L measured in Cav1.3−/− cells.

