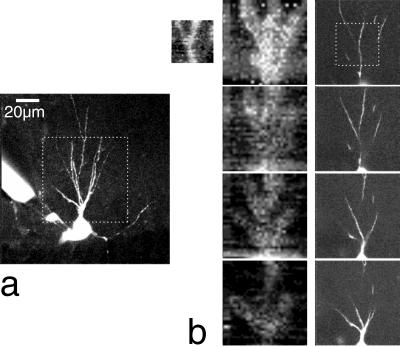
Figure 6.
Mapping of glutamate-evoked currents. (a) Hippocampal pyramidal neuron filled with 100 μM fura-2 (image stack of 51 frames taken at 1-μm intervals, median filtered and maximum projected). (b) Maps (Left) of glutamate-evoked currents (current range is 33 pA between white and black) on dendrites taken at 4-μm depth intervals, with corresponding fluorescence images (projections of ±3 positions, right). The small image at left shows a higher-resolution scan. Laser power for uncaging images was 35 mW. Bar in a (20 μm) applies to all images. The superfusion solution contained 0.5 mM Bhc-glu and 100 μM cyclothiazide.

