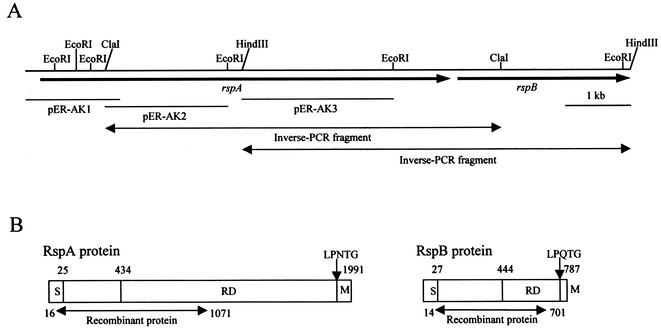
FIG. 1.
Schematic diagram of E. rhusiopathiae genomic region encoding rsp genes and the structural organization of rsp gene products. (A) rspA and rspB genes are represented by arrows. Horizontal solid lines, positions of the cloned fragments of the plasmids pER-AK1, pER-AK2, and pER-AK3; horizontal double-headed arrows, regions amplified by inverse PCRs. (B) S, signal peptide; RD, repeat domain; M, the membrane-spanning region and positively charged residues. Numbers indicate the positions of amino acids in the proteins.

