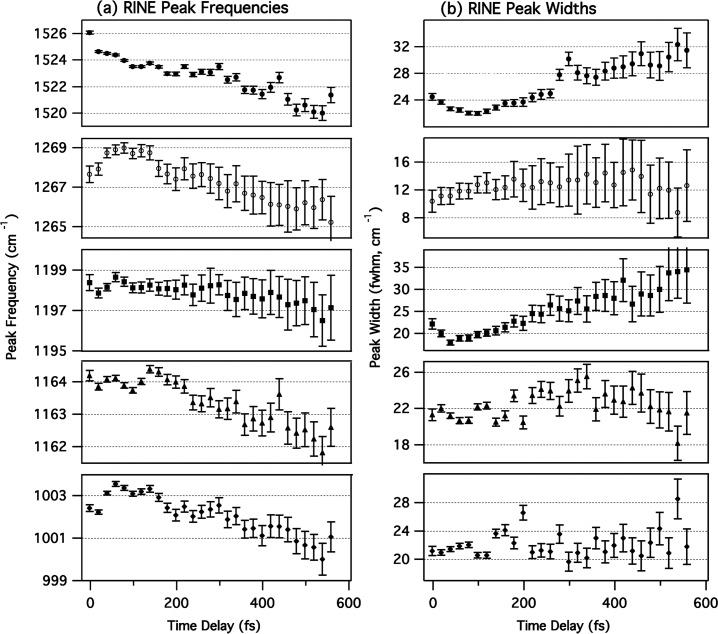
Figure 6.

Bacteriorhodopsin RINE peak positions and widths determined using the line shape function from eq 4, where ω g(n,n+1) is the vibrational frequency and 2γ g,n is the peak width (Lorentzian fwhm). Errors are 1 standard deviation determined by the nonlinear least-squares fitting procedure. Only the major peaks in the spectra are shown: C=C stretch (), C11–H rock (○), C14–C15 stretch (■), C10–C11 stretch (▲), and methyl rock (◆).
