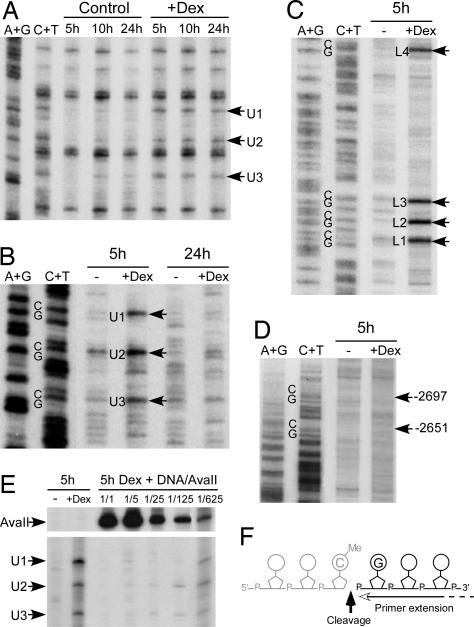
Fig. 4.
DNA is cleaved 3′ to the methylated cytosines during glucocorticoid-induced demethylation. Hepatocytes isolated from E15 fetuses were cultured for the indicated time (hours) without (control or −) or with (+Dex) 10−7 M dexamethasone. (A) Kinetics of glucocorticoid-induced DNA demethylation in hepatocytes analyzed by LM-PCR by using genomic DNA treated with hydrazine-piperidine as described in Fig. 1B. (B) Native genomic DNA was analyzed by LM-PCR to visualize strand breaks in the upper strand of the −2.5 Tat GRU. The arrows indicate the bands revealing cleavage at MeCpG. (C) Analysis of the lower strand as in B. (D) Analysis of the upper strand in an upstream region where there are two MeCpGs that are not demethylated. The arrows indicate the location of the corresponding Cs. (E) Competitive PCR analysis of the abundance of the glucocorticoid-induced cleavage products. A fixed amount of genomic DNA from fetal hepatocytes treated for 5 h with dexamethasone was diluted with varying amounts of rat genomic DNA digested with AvaII that cleaves just upstream the −2.5 Tat GRU and analyzed by LM-PCR. The relative amount of the competing liver DNA corresponded to either the same amount (1/1) or serial 5-fold dilutions (1/5 to 1/625). The regions of the gel showing the bands corresponding to the AvaII cleavages and the dexamethasone-induced cleavages at the MeCpG are shown. (F) Representation of the location of the strand break detected relative to the CpG dinucleotide. Note that LM-PCR allows only analysis of the fragment downstream the break and thus that the location and nature of the 3′ end of the upstream fragment (represented in gray) cannot be assessed.

