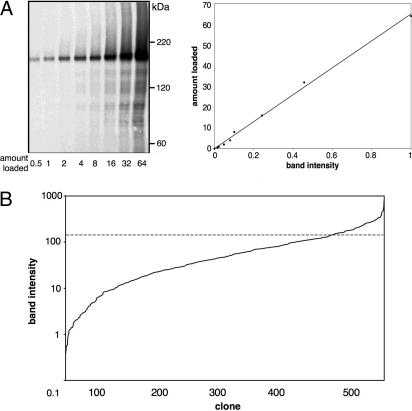
Fig. 1.
Quantification of protein expression. (A Left) Increasing amounts (arbitrary units) of purified Pga3p-HA-His-8-Suc2-His4C were loaded onto 6.25% SDS/PAGE and visualized by Western blotting with anti-HA antibody. (A Right) Quantified band intensities versus amount of protein loaded (r2 = 0.997). (B) Relative expression levels for 553 cloned S. cerevisiae proteins. The dashed line indicates an expression level of ≈0.5 mg/liter as estimated from GFP-fusions (see Results and Discussion).

