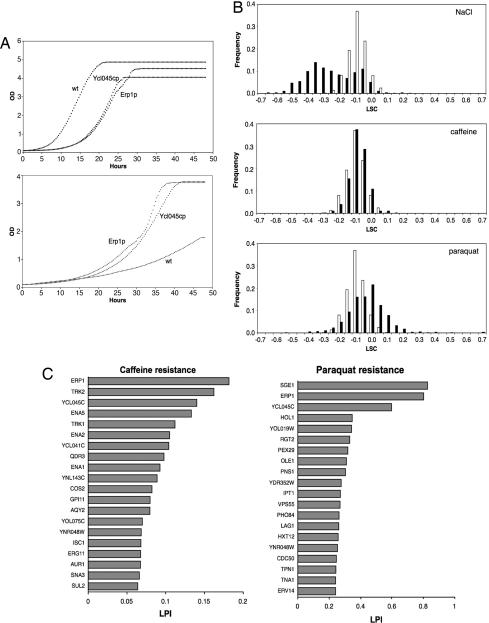
Fig. 2.
Phenotypic consequences of membrane protein overexpression. (A) Growth curves in synthetic defined medium (Upper) and under oxidative stress (Lower) for the reference strain transformed with empty vector (wt) and strains overexpressing Erp1p and Ycl045cp. (B) Distribution of phenotypes (LSC) during no stress (open bars) and stress (filled bars). Negative LSC values indicate reduced fitness. (C) Phenotypes (LPI values) for the top 20 most stress tolerant (P < 0.001) overexpression strains.

