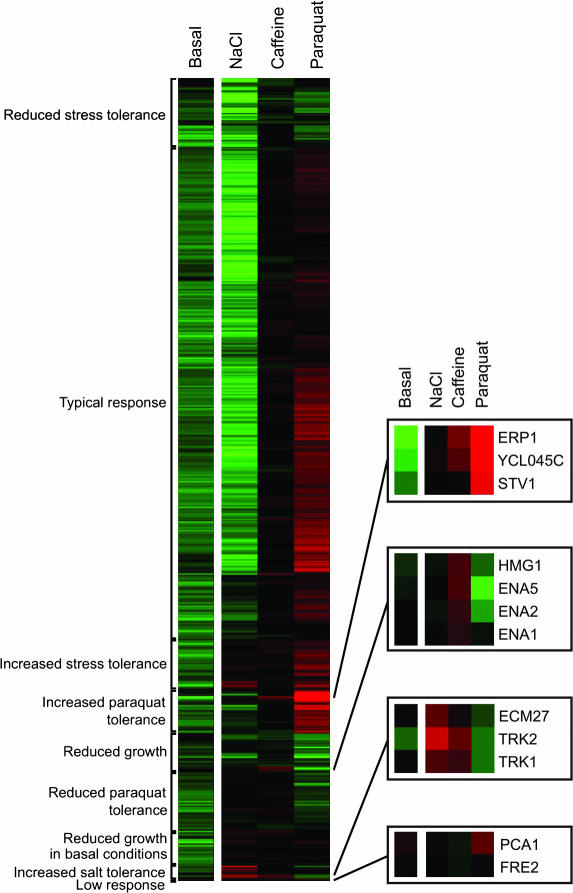
Fig. 4.
Hierarchical clustering of overexpression phenotypes recorded in synthetic defined medium (basal conditions; LSC values) and different stress conditions (NaCl, caffeine, and paraquat; LPI values). Green indicates a reduced growth rate, and red indicates an increased growth rate relative to the reference STY50 strain.

