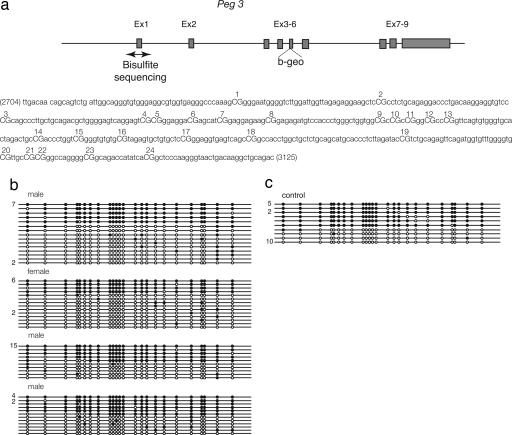
Fig. 2.
Methylation status of the Peg3 differentially methylated domain analyzed in progeny of XY females mated with normal males. (a) Schematic representation of Peg3. The β-geo cassette was knocked-in to the 5 exon (14). The double-headed arrow indicates the region in which methylation was analyzed. (b and c) Each line corresponds to a single strand of DNA, and each circle represents a CpG dinucleotide on that strand. The number of strands observed with a given methylation profile (if greater then one) is indicated to the left of each line. Twenty-four CpGs were analyzed by bisulphite mutagenesis and sequencing. A filled circle represents a methylated and an open circle an unmethylated cytosine. (b) Analyses were performed on three male and one female progeny of XY females. (c) Control sample.

