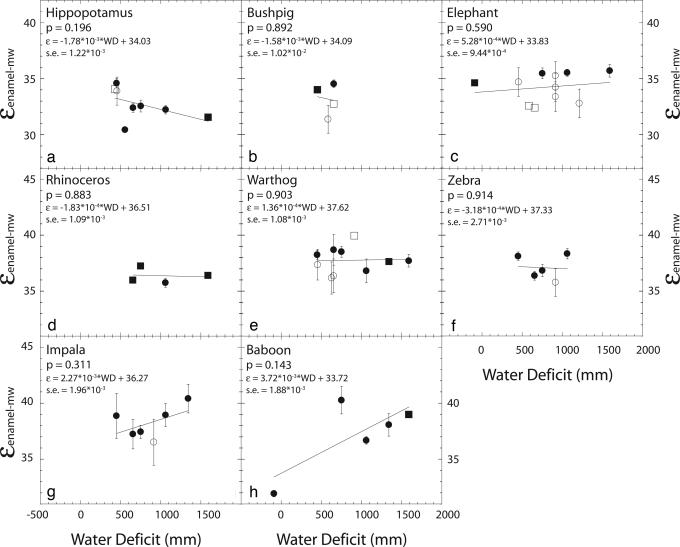
Fig. 1.
εenamel-mw values for hippopotamus, bushpig, elephant, rhinoceros, warthog, zebra, impala, and baboon, plotted against water deficit (WD) (a–h). Circles represent εenamel-mw values calculated from average δ18Oenamel values at a location, whereas squares represent εenamel-mw values calculated from sites where the δ18Oenamel value from only one tooth was available. Error bars report the standard error associated with each ε value. No error bars are reported for εenamel-mw represented by squares. Filled symbols (●, ■) represent εenamel-mw values calculated from measured δ18Omw values, whereas open symbols (○, □) represent εenamel-mw values calculated from a regional δ18Omw average, −3.1‰. The linear regression, P value, and the standard error (s.e.) on the regression coefficient are reported for each plot.

