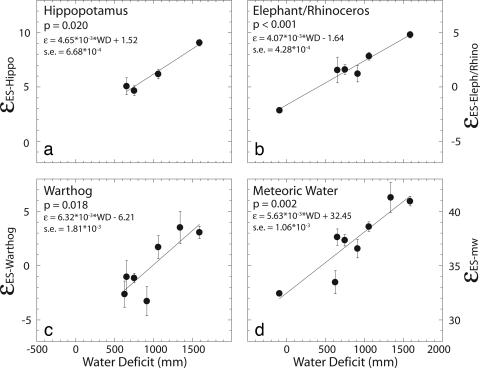
Fig. 3.
The isotopic enrichment (ε) between ES δ18Oenamel values (averaged values of all ES specimens at each site) and δ18Oenamel values of hippopotamus (a), elephant/rhinoceros (b), warthog (c), and meteoric water (d) is plotted with water deficit. ES and EI taxa are grouped based on ANOVA results presented in text. Linear regressions, P values, and the standard error (s.e.) on the regression coefficient are reported for each plot. Error bars represent the standard error associated with each ε value.

