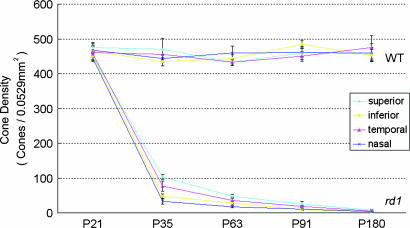
Fig. 1.
The change in cone cell density over time in different regions of the retina in rd1 mice in a C57BL/6 genetic background. At several time points between P21 and P180, C57BL/6 mice, either wild-type or homozygous for the rd1 mutation (n = 6 for each at each time point), had cone cell density quantified in 0.0529-mm2 bins 1 mm superior, inferior, temporal, or nasal to the center of the optic nerve, as illustrated. Each point shows the mean (±SEM) calculated from measurements in six mice. In wild-type mice, there was no difference over time in cone cell density and no difference in different regions of the retina. In rd1 mice, there was a rapid decline in cone cell density between P21 and P35 and then a more gradual decline over the next 2 months. Cones were still detectable at P91 but not at P180. The rate of decline was greatest in the inferior and nasal parts of the retina and least in the superior part of the retina.

