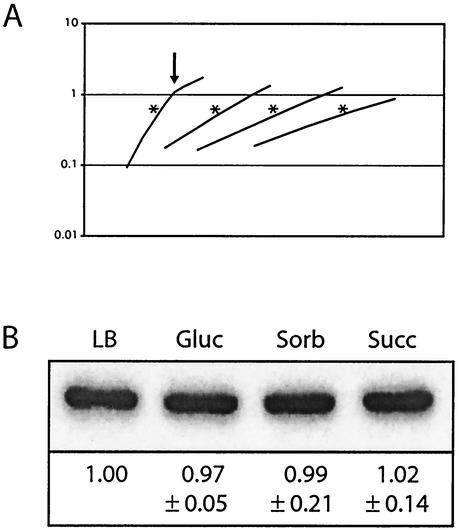
FIG. 4.
FtsZ levels remain constant regardless of growth rate. (A) Representative growth curves for wild-type B. subtilis cells grown in LB medium, minimal glucose (Gluc), minimal sorbitol (Sorb), or minimal succinate (Succ) (from left to right, respectively). Samples were harvested at an OD600 of ∼0.600, which is marked in the figure by an asterisk. Arrows, when present, indicate where a culture has exited from exponential-phase growth. OD600 is shown on the y axis. (B) Representative quantitative immunoblot of FtsZ from wild-type B. subtilis cells grown in LB medium, minimal glucose, minimal sorbitol, and minimal succinate. Samples were harvested during exponential growth and normalized to total protein at gel loading. Relative concentrations of FtsZ, normalized to those for wild-type cells grown in LB medium, are shown below. Margins of error were calculated by using a t test with a 95% confidence level and are based on data from three independent experiments (i.e., three separate sets of cultures).

