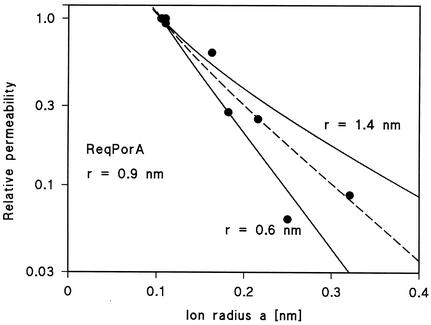
FIG. 7.
Fit of the single-channel conductance data of the cell wall channel PorAReq as determined by multiplying the Renkin correction factor by the aqueous diffusion coefficients of the different cations. The product of the two numbers was normalized to 1 for a = 0.105 nm (Rb+). Single-channel conductances were normalized to the ones of Rb+ and plotted versus the hydrated ion radii taken from reference 50. The closed points correspond to Li+, Na+, K+, NH4+, Cs+, N(CH3)4+, N(C2H5)4+ and Tris+, which were all used for the pore-diameter estimation (see Discussion). The fit (solid lines) is shown for r = 1.4 nm (upper line) and r = 0.6 nm (lower line). The best fit was achieved with r = 0.9 nm (diameter = 1.8 nm), which corresponds to the broken line.

