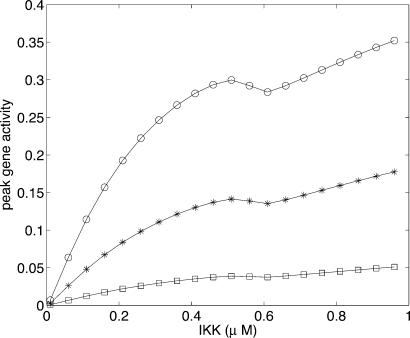
Fig. 7.
Nonequilibrium binding of NF-κB to a downstream gene. The plot shows the peak gene activity as a function of IKK concentration, with koff = 1/260 min−1 kept fixed (1/koff is twice the time period of oscillations). kon ≈ 0.04, 0.015, and 0.004 μM−2·min−1 for circles, asterisks, and squares, respectively.

