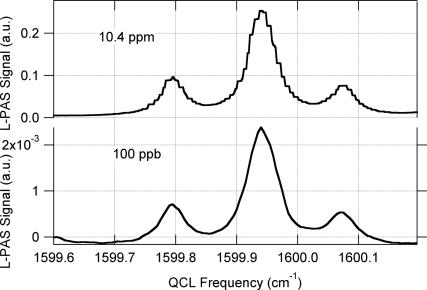
Fig. 3.
L-PAS scans across the selected NO2 spectral feature (A in Fig. 2) in CDA. The upper trace shows 10.4 ppm NO2. The step changes in the signal intensity are due to external cavity mode hops. The lower trace shows five point-averaged 100-ppb NO2 data (see text).

