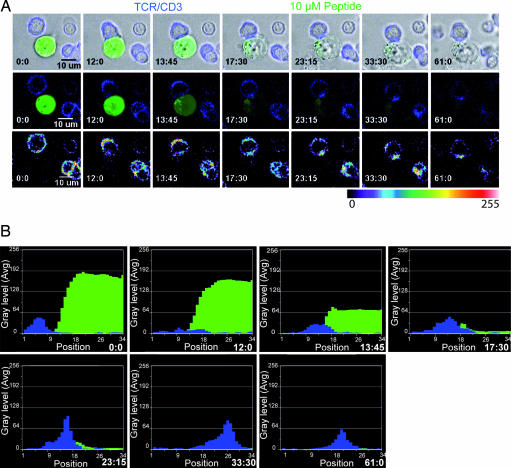
Fig. 2.
TCR clustering at the CTL/target cell interface is accomplished after lethal hit delivery and is sustained for a prolonged period. (A) CTL stained with anti-CD3 Fab (blue) are interacting with a target cell pulsed with 10 μM peptide concentration and loaded with calcein (green). The panels depict two CTL interacting with one target cell. (Top) Overlapping of differential interference contrast microscopy images with CD3 and calcein staining. (Middle) Only blue (CD3) and green (calcein) fluorescence are shown. (Bottom) TCR staining intensity using a pseudocolor scale. The snapshot sequence corresponds to Movies 4 and 5. (B) Analysis of CD3 fluorescence intensity at the CTL/target contact site and of calcein fluorescence intensity in target cell. The analysis corresponds to the snapshot sequence presented in A. Data are from Movie 4. A line was drawn at the contact site between the CTL and the target (see Movie 6), and the intensity of green and blue fluorescence was measured on unprocessed images all along this line. The full snapshot sequence is shown in Movie 6. Data are from one representative experiment of six. Treatment with concanamycin A (a selective inhibitor of perforin pathway) inhibited calcein leakage from targets (data not shown).

