Fig. 3.
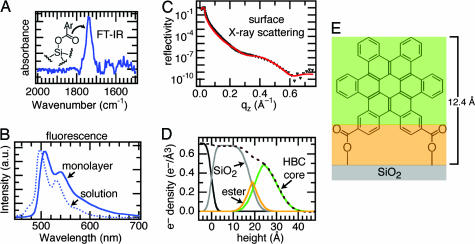
The HBCs form dense, upright monolayers on the surface of silicon oxide. (A) Carbonyl region of the FTIR spectrum of a silicon wafer after reaction with 1B. (B) Comparison of solution (6.4 × 10⁻⁶ M in THF) and monolayer fluorescence emission of 1B (excitation at 385 nm). (C) Surface x-ray scattering of 1B. Data, black triangles; fit to a three-layer model (red line). (D) Real-space model of the fit from C showing the deconvolution of the electron density into three layers: silicon oxide, ester, and HBC. (E) Model with three layers color-coded to the real-space model.

