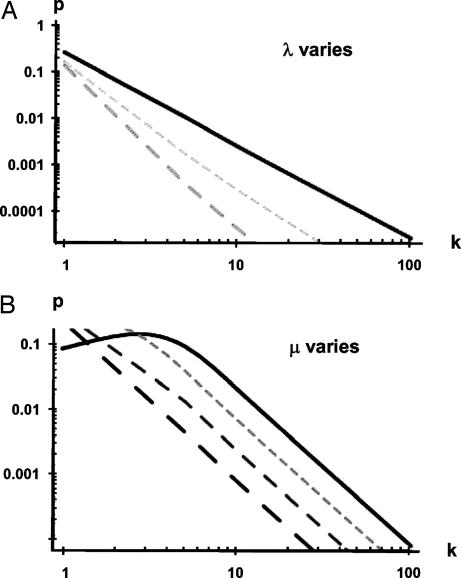
Fig. 3.
Dependence of degree distributions on the parameters λ (A) and μ (B). (A) Effects of varying λ. Solid line, λ = 1; short dashes, λ = 1.5; long dashes, λ = 2. The value of μ is fixed at 10. (B) The parameter λ is held fixed at 1.0 while μ is varied between 7 (upper curve) and 10 (lower curve) in steps of unity. Solid line, μ = 7; short dashes, μ = 8; intermediate dashes, μ = 9; long dashes, μ = 10. The value λ is fixed at 1.

