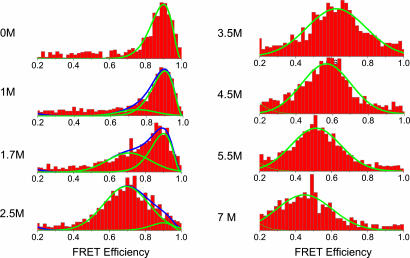
Fig. 1.
FRET efficiency histograms of individual protein molecules at increasing concentrations of denaturant (0–7 M GuHCl). The histograms reflect first unfolding of the protein from its folded to its denatured state, followed by further expansion of the denatured state, which is seen as a gradual shift of the denatured-state distribution to lower values of FRET efficiency.

