Fig. 4.
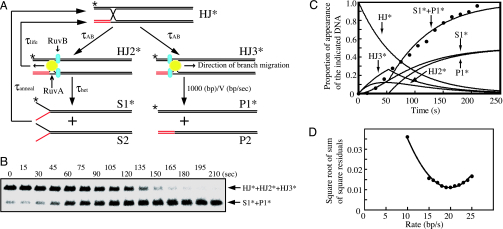
Biochemical analysis of Holliday junction branch migration. (A) Schematic diagram of RuvAB-mediated branch migration. Computer simulations follow the diagram, which is simplified in comparison to the diagram reported in ref. 14. (B) Branch migration assays were carried out as described in Materials and Methods. The result at 500 μM ATP concentration is shown. Aliquots were taken at the indicated times. Deproteinized reaction products were analyzed by 0.8% agarose gel electrophoresis containing 2 mM MgCl2. ∗, 32P labeling. (C) Time course of dissociated-product appearance during branch migration. Filled circles indicate experimental points of dissociated-product appearance during branch migration as shown in B. The lines represent computer-generated simulations of the appearance of the indicated substrates or products. (D) Minimization analysis for the best-fit branch migration rate. Square root of sum of square residuals plot versus branch migration rate was determined by constraining the branch migration rate (bp/s) to have a constant value between 10 and 25 and then optimizing the fit by using Eqs. 1–3, 5, and 6 described in Supporting Text.

