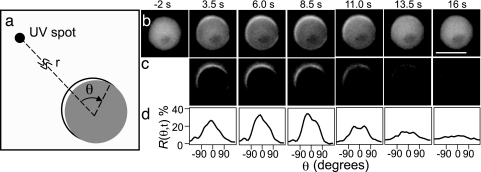
Fig. 1.
Dynamic translocation of CRAC–GFP at the plasma membrane after stimulation with a 2-s pulse of cAMP. (a) The UV uncaging location is positioned a distance r away from the cell center. The angle θ defines the coordinate along the cell’s periphery, where θ = 0 defines the position at the membrane that is closest to the uncaging location. (b) Unprocessed epifluorescence images displaying CRAC–GFP as a function of time. The scale bar denotes 10 μm and r = 70 μm. (c) Subtracted images illustrate the relative change of CRAC–GFP concentration in the membrane with respect to the prestimulus level (t = −2 s). (d) Response function R(θ,t) as a function of time for the images in c.

