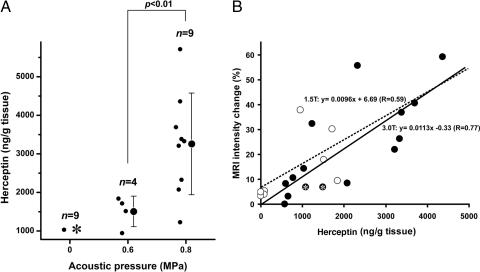
Fig. 2.
Delivery of Herceptin into mice brain by MRI-guided focused ultrasound-induced BBB disruption. (A) Herceptin concentration in sonicated tissues after focused ultrasound-induced BBB disruption. The concentrations of Herceptin in the sonicated or control tissues are plotted as a function of the applied acoustic pressure. Raw data (●) and the mean ± SD are shown. In the control (0 MPa), Herceptin was below the lower limit of the detection range (780 ng/g of tissue) in eight of nine cases (asterisk). The concentration of Herceptin in the sonicated tissue increased as a function of the applied power [0.6 vs. 0.8 MPa: P = 0.004 (Welch test)]. (B) Correlation between tissue Herceptin concentration and MR-intensity changes after BBB opening induced by focused ultrasound. The MR-intensity changes as a function of the tissue Herceptin concentration are plotted. Data obtained with the 3.0-T and 1.5-T MRI scanner are plotted as ● and ○, respectively. Data points with a Herceptin concentration below the detection limit (780 ng/g of tissue) represent estimated values calculated from the A405 by using the Easy-Titer Human IgG (H+L) assay kit. The MR intensity and Herceptin concentration showed a good correlation (R = 0.59 for 1.5 T and R = 0.77 for 3.0 T). Two asterisked data are not included for analysis in A because an i.v. catheter problem made the injection of Optison unsuccessful, which affects the BBB opening by ultrasound.

