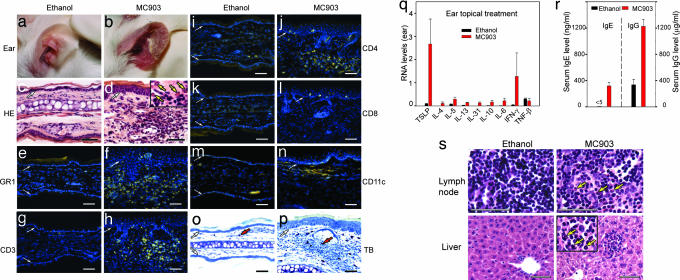
Fig. 2.
Topical treatment with MC903 triggers an AD-like skin inflammation. (a and b) Appearance of ethanol- and MC903-treated ears at day 17. (c and d) Hematoxylin and eosin-stained ear sections of ethanol- and MC903-treated mice at day 17. Eosinophils displaying cytoplasmic red staining are indicated by yellow arrows in d Inset. (e–n) IHC performed on ear sections from ethanol- or MC903-treated mice at day 17, with antibodies against GR1 (e and f), CD3 (g and h), CD4 (i and j), CD8 (k and l), and CD11c (m and n). Yellow corresponds to staining of antibodies, whereas blue corresponds to DAPI staining of nuclei. (o and p) Toluidin blue (TB) staining of ear sections. Red arrows point to one of the mast cells with intense blue in the dermis. White arrows in c–p point to the dermal/epidermal junction. (q) Cytokine RNA levels in ethanol- and MC903-treated ears at day 17. (r) Serum IgE and IgG levels of ethanol- and MC903-treated mice at day 17. (s) Hematoxylin and eosin-stained sections of ear-draining lymph node and liver of ethanol- and MC903-treated mice at day 17. Yellow arrows point to three of many eosinophils (red cytoplasmic staining) in sections of lymph node and liver of MC903-treated mice. (Scale bars, 50 μm.)

