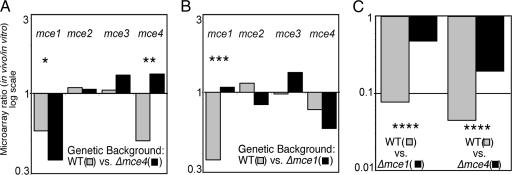
Fig. 2.
Positive and negative interactions identified by using TraSH. (A and B) Microarray ratios from each gene of the indicated mce loci were averaged. Only genes that remain intact in the Δmce1 and Δmce4 strains were included in this analysis. Ratios from the wild-type (gray bars) or the indicated mce-deficient backgrounds (black bars) are plotted on a log scale. (C) Ratios for mceG (i.e., rv0655) mutants are plotted in a similar manner. Asterisks indicate statistical significance by t test (∗, P = 0.029; ∗∗, P = 0.008; ∗∗∗, P = 0.044) or ANOVA (∗∗∗∗).

